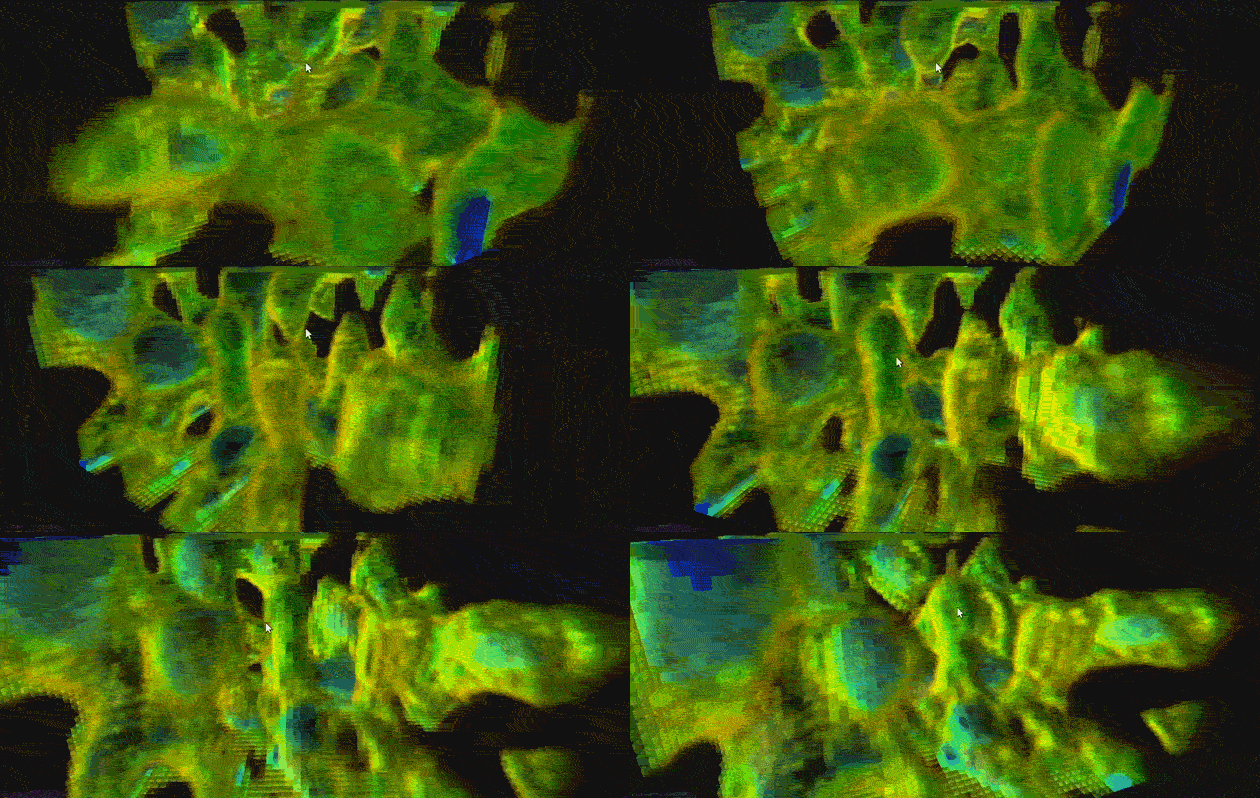
If you’re old enough to remember CRT TV’s with the big bunny ear antennas, you’re likely to understand how easily radio signal strength can be affected by even a tiny move of the receptor. A similar principle applies to WiFi signals, and the above visualization drives the point straight home. It’s a 3D map of YouTuber CNLohr‘s WiFi signal in his home, albeit that of the relatively small area (360x360x180mm) within his CNC mill. See, to get this done he hooked up a ESP8266 WiFi module to his laptop, which gave him signal strength in real-time at 500Hz. He then mounted the module inside a large gantry-style cnc mill and took several long exposure shots, which he then composited in Voxeltastic, [CNLohr’s] own HTML5/WEBGL based render engine. The results can be seen above, and although it looks completely organic, it follows a pattern: “the signal strength increases and decreases in nodes and anti-nodes which correspond to the 12.4 cm wavelength of a WiFi signal.” And it also goes to show that if you’re having problems with reception, you might want to consider just moving your router a tiny bit before you start cursing it.
[ CNLohr’s Instructables ] VIA [ Engadget ]


